
[label style=”info”]हुने हार दैब नटार[/label] – even the god can’t stop unavoidables. No matter how much the Government pretends, the Nepalese education system has failed time and again. It is pretension NOT the investment as the consequent evens exposure annually and nothing is done to cover them. There has been an epic fail. SLC is a fallacy concept.

Never Ending SLC’s Importance
Despite the huge money invested thrown to education sector, the outcome of SLC – the exam which is considered to be the Iron Gate in Nepalese student’s life, has always brought a sense of incompleteness and biasness to the sympathetic Nepalese students. SLC Results in Nepal has been treated like the most ONLY important academic value which is the first myth being advertised.
Nobody – no any academic institute private or community based, neither the government nor the education ministry – have any serious planning to bring in improved education with quality rather than aiming to have increased SLC passed results – grace mark of 5, re-chance, sector wise varying questions, flexibility in copy checking, and we know some more. No matter what, the results have always been saddening and discriminating the students of the rural and the urban areas.
SLC Results in Figures
The statistics of SLC Results in Nepal has always been teaching us that it is all wastage of money, time, resource, development and you name it. Every sector has been committing a crime – or do we say mistake – or rather we say every sector has been committing a repetitive crime now and then – and the poor students, their parents and the country men have been fooled around since long.
Let’s forget the qualitative aspect of the education being delivered (we can’t argue, not even the ministerial level approach can win the argument with the private sector education giants), what is being mattered is the quantitative aspect of the education, how many passed – how many failed – specifically did my son or daughter got a distinction marks – who cares what kind of quality education brought that distinction marks!

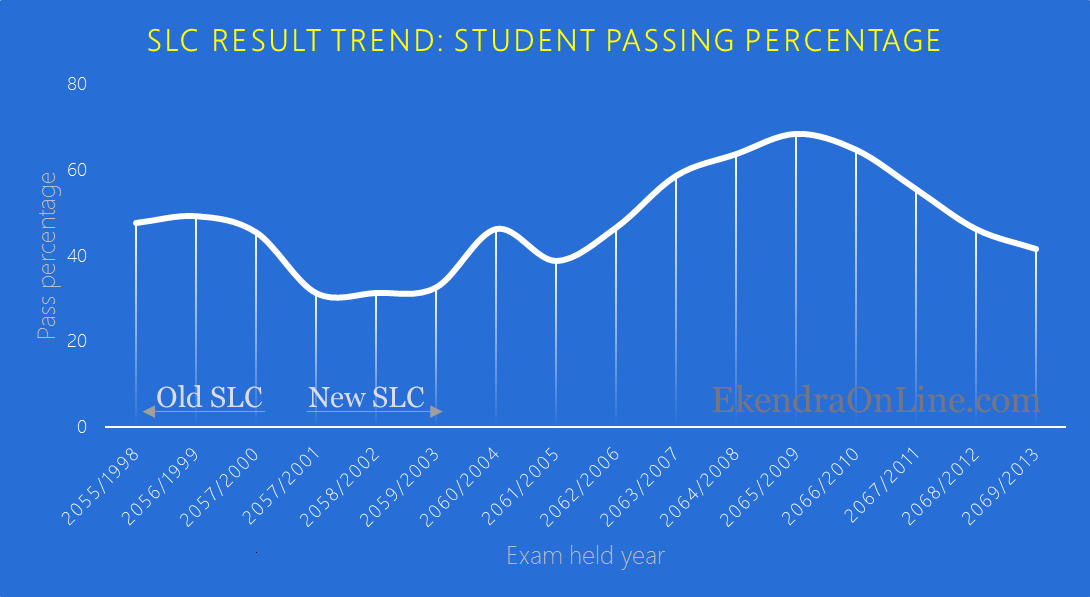
The graph above gives the trend of SLC result in Nepal – with little bit of old SLC format before 2057 BS and new SLC afterwards. The new SLC format performed all time worst results – it is only with some really better student oriented approach (not education oriented approach!) that the strings of SLC was at highest during 2065. The analysis of SLC results with all available data, statistics or experience, or whatever you name it, proves one thing – SLC is a total wastage. It has never proved a fruitful schooling education at least in terms of pass percentage.
A pertaining fact that expose the inefficiency of the concerned in the education system – the investment in education sector in 2068 just quadrupled in less than 4 years term. The budget of Rs 63.91 billion investment brought no good results for 2068 SLC performance – just another issue to be made (!)

- SLC Exam attendees versus no. of passed students over 5 years duration
BS 2067 SLC exam saw the introduction of grace 5 marks, sadly that failed to bring in any good in the overall results. The logarithmic trend line passing over the number of SLC exam attendees and the passed students are always parting from each other. The prediction of 2070 SLC examination shows that even lesser number of students would pass as compared to the number of attendees. The trend of no. of SLC exam appearing students versus trend of passing are two sides of a departing train leagues which are never going to meet! (Any good example???)
Statistical Formulation
For the mathematics and statistic junkies, the average separation values of the attendees and passed students over the logarithmic trendline is computed almost ~5 % as shown in the above graph. This means that every year the number of failed appeared SLC student will increase by 5% more of the attendees as compared with the previous year. Simple mathematics is used for this calculation. Interested and stat experts might carry in depth analysis.
[note color=”#CCFF99″]
R-squared value of the log trendline for SLC attending students in Nepal: R² = 0.9948
R-squared value of the log trendline for SLC passing students in Nepal: R² = 0.6684
[/note]
Which schools have the best SLC result?
Should you care which schools, in an environment where we give the default name of “Sarkari school” and “Boarding” – the word boarding is used to refer to private school as if there is no “school” thing involved, and Government/Community schools are always undervalued. People proudly say “my kid has gone to boarding” they don’t like to call simply “my kid has gone to school” even though s/he has gone to a private school – the common sense fallacy. The statistics has something more to tell about when it is SLC result and community versus institutionalized schools are to be compared.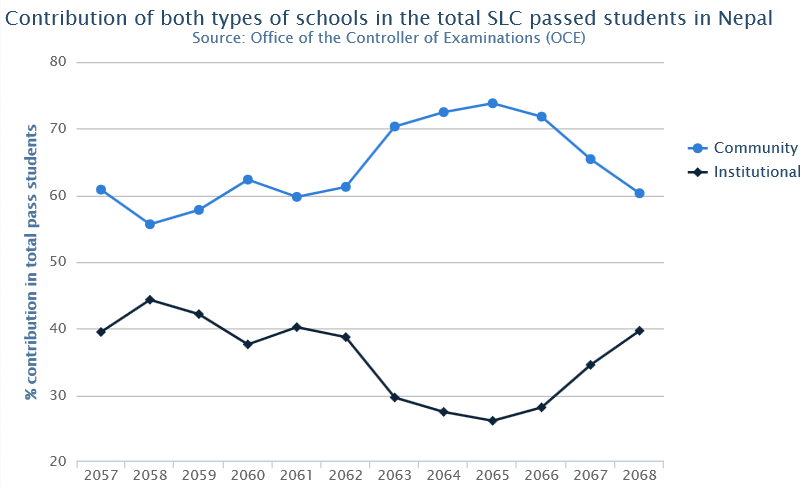
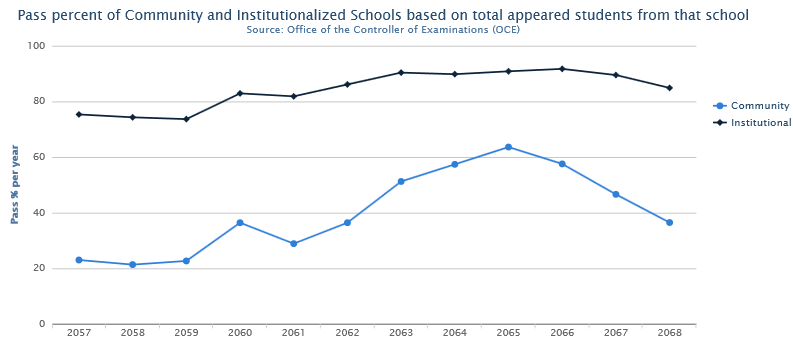
Institutionalized private boarding schools have their strong hold on the threshold of minimum pass percentage contribution as of their total SLC appearing students. The pass threshold for such private schools mark at least 75% whilst the scenario of community school is quite saddening. Even tho’ community schools contribute much they have very low pass percentage (safe average of 40%) with respect to the total SLC appearing students from such schools.
SLC exam statistics show both pass percentage of total appeared versus total pass students; and pass percentage in private and Government schools is spreading as always. Moreover, these two different factors are also broadening themselves. The charts quickly allow us to boost moan that (as mentioned by SparrowSMS)
- The majority of students passing SLC in Nepal come from community based schools.
- Private schools are much more efficient in their ability to pass more students per appearing batch as compared to community based schools.
Does SLC Results analysis really matter? What’s wrong with SLC Exam?
The quick and short answer is NO. It doesn’t matter to analyze the trend of SLC results, for a series of reasons. There are enough provoking thoughts as why SLC is a wastage of both money and time – WhyNepal has a good article about that (Scrap SLC ! It is a waste of our money and time.)
- SLC, exam after class 10, is not a standard degree. It is after the class 12, called “High School”. Since we are following standard 4 years of Bachelor level education why not follow the standard of High school education? Nepal Government and the education sector should end up this culture of celebrating class 10 as standard.
- Holy crap, so many exams. Should this point have been #1? SLC is just the exam on the middle of district level exam at class 8 and national level exam at class 12 – the fear is simply macabre. Is anyone listening? or even planning to have a superficial fixing of the exam structure that has been ruining lives of thousands and lakhs of students in Nepal every year?
- Invalid statistical approach of SLC results are proven by the fact that the exam is unfair and not standardized in any aspects. (Quote: a fish, a monkey, an elephant and a dog climging a tree and saying a fair test – as described in WhyNepal article)
- Are we counting on number of incapable jobless? Looks like. Incapable in sense after failing SLC exams, jobless in sense SLC aint sufficient. This is a never ending vicious circle of confusion and complications syringed inside our phrenal cortex.
- What’s in numbers anyway? The statistics of SLC examination is all numbers, better untouched than played around. Sadly, the Government or concerned offices never publish the trend of SLC results and exams, all they do is publish the figures – no analysis or whatsoever.
Conclusion: SLC has failed!
Are we over exaggerating here? A commonsense spell- SLC is not performing – and that is the final conclusion no matter how many analysis and what level of analysis is performed for the SLC exam results in Nepal. The decrease in the pass percent consecutively for so many years has exposed the weakness of the education institution, the Government policies and failure of the system at-large.
Personally I welcome comments and constructive criticism from the readings and researchers about this.
More suggestive readings (none of them have comparative & indepth analysis of the SLC statistics)
- SLC Study Report: Here is a Study on Student Performance in SLC as “SLC Study Report” – Determinants of student performance in the SLC Examinations, prepared for the Ministry of Education and Sports. This report gives everything in numbers as sampled from specific regions regardless of the whole country’s figure. Download the full report (pdf)
- प्रबेशिका परीक्षा (SLC) मा ५८.५०% परीक्षार्थी अनुतिर्ण दोष कस्को? from BlogChautari
- Investment in education gone to waste? from eKantipur ref 2012
- NepaliTimes: How to achieve a 100 per cent pass rate in the SLC
- SparrowSMS – sources of two images at lower half of the article. SLC Result 2013- who’ll be doing it better?
- Cartoon source: Dipak Gautam published at eKantipur

Great one, as I just learnt Nepal is 30th failed states in the world – so should Education account for! All the politicians are busy with their dirty tricks and citizens have been fooled around – anybody got time to look after this report?
SLC has failed and that’s the reality! Wait, SLC isn’t failing it is our state, our dirty cheap politicians who make our education system fail despite of what students want, simply because they are ignorant and uneducated.
Pingback: SLC Exam 2070/2071 Routine Published, Exam onward 2070 Chaitra 6
I’m an ICT in Education Professor in a western university. We study pattern of school education and associated pedagogy. I came across SLC result analysis in Nepal in your website which is, I doubt any government agency in Nepal would dare to perform, perfect at what it tells to deliver.
The trending pattern obviously gives so many of negative impacts and ongoing bad tradition in Nepal in the primary schooling despite many NGOs and INGOs spending dollars on. It is high time that the Government think seriously about a quality education in Nepal.
Thanks for the data, and the figures.
Pingback: Staring at the Iron Gate: SLC is coming up » Local Nepal Today
Pingback: Understanding Project Management tools and how to find best fit your project or program! | EkendraOnLine.com