
Are you glued to Microsoft Teams like many of us – precisely 145 million DAU like us – in this complete work from home or hybrid work scenario? If yes, Teams probably is your one stop collaboration hub for most work-related activities. In this article, we present how to analyze your personal Microsoft Teams based activities using Power BI features. You’d love to see your own personal stats in a lovely graphs and stats from Power BI.
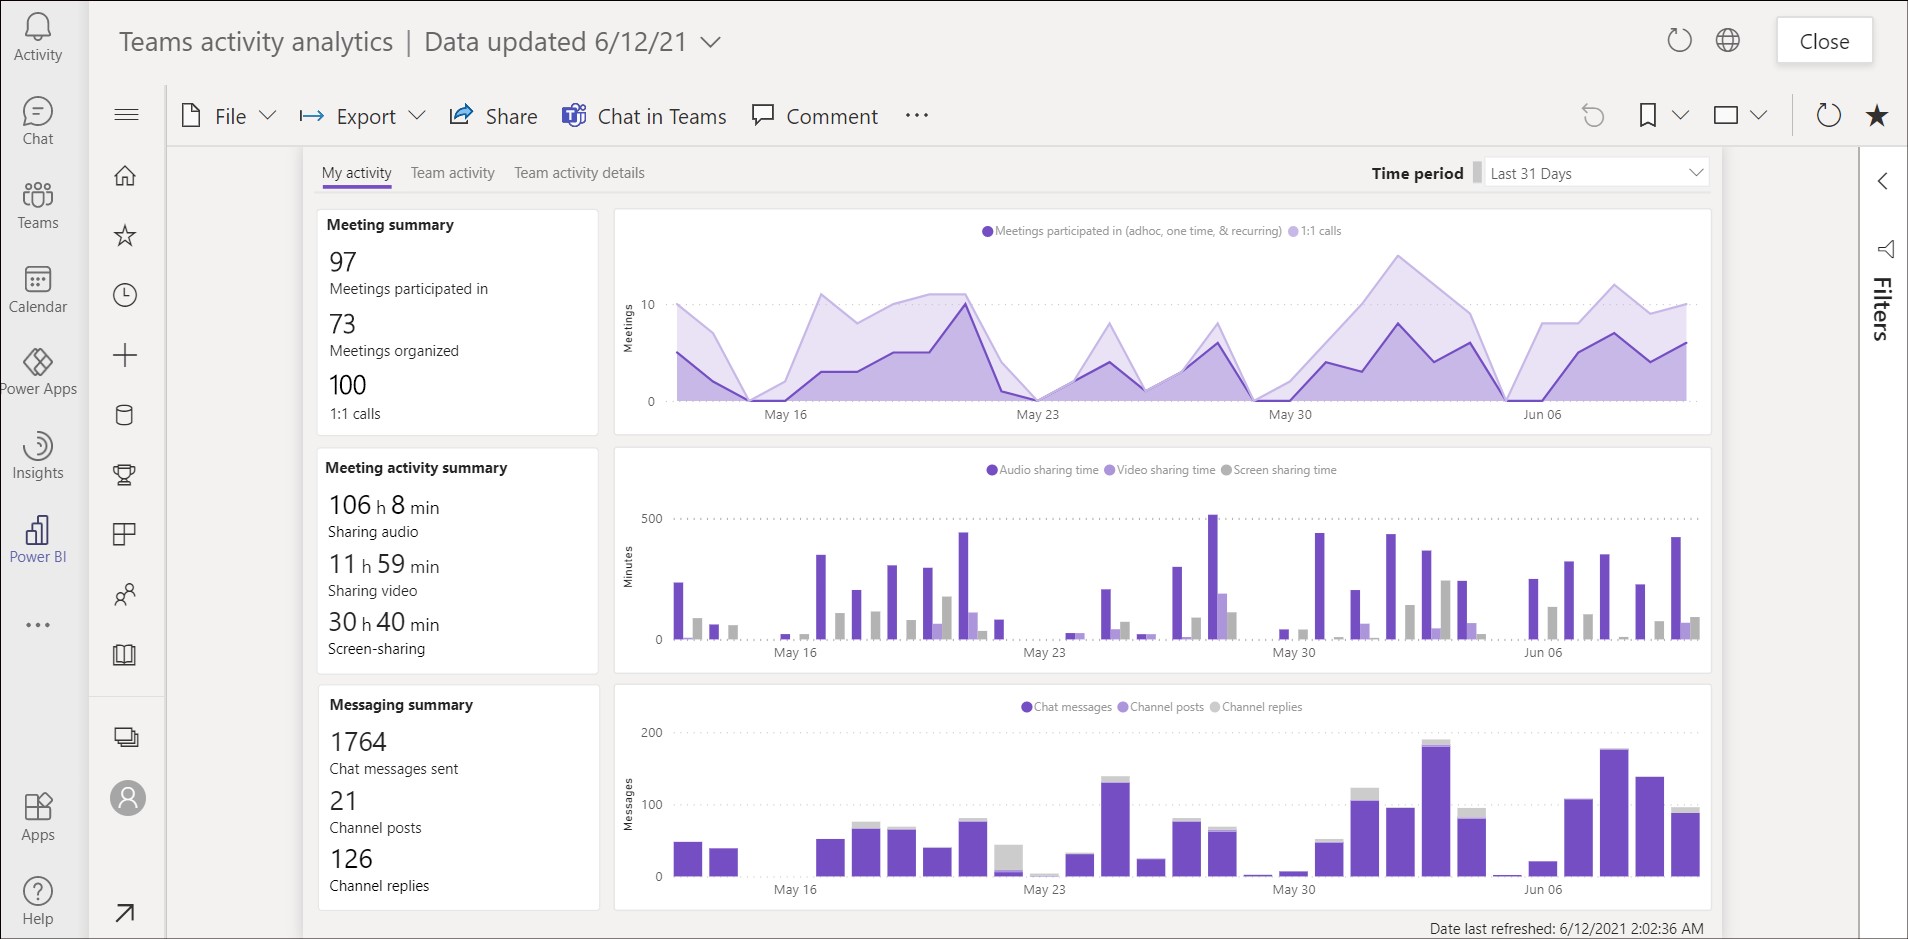
I participated in 97 meetings in the last month spending about 5 hours daily in meetings and sending 91 conversation messages. ~ the power of Power BI for Microsoft Teams analytics
The Power BI app in Teams
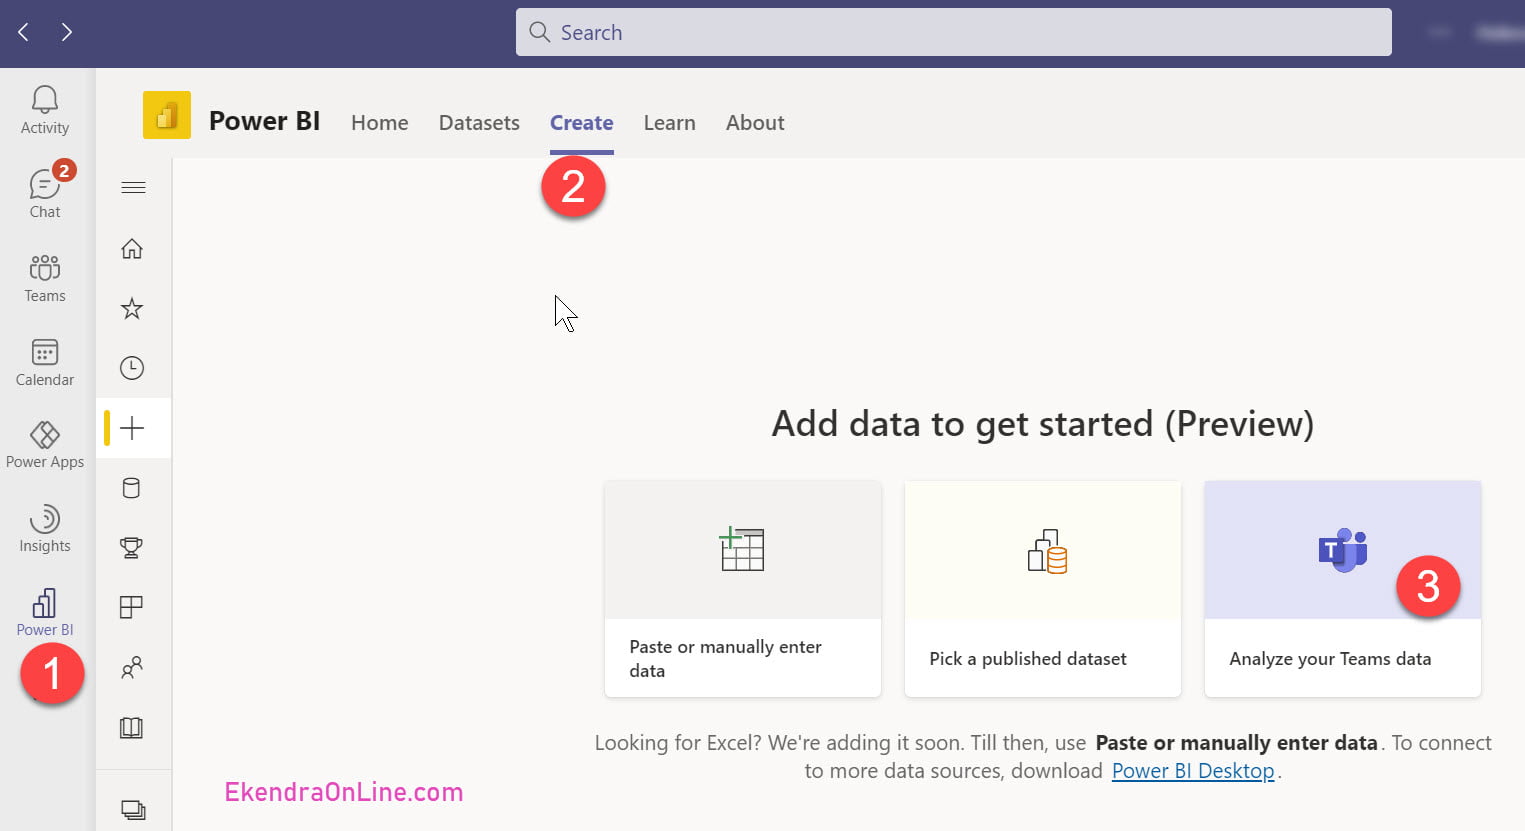
Open Microsoft Teams and add Power BI to the list of your apps, pin it to your left sidebar items if you have space. On the Power BI app’s horizontal navigation, click “Create” and select “Analyze your Teams data” from Add data to get started.
Power BI then connects to all of your personal activity data inside the Teams and generates eye-candy graphs and stats for you. While these Teams analytics may not direct assist in your daily work productivity, these are definitely designed to track our activities in Teams and produce that feeling of being productive. Or understanding the metrics!
Microsoft Teams activity analytics
While we are referring to personal activity in Teams for these analytics, the graphical reports are produced for “My activity”, “Team activity” and “Team activity details” – meaning your entire involvement in Teams.
Few mentionable key analytical parts combined from all of these three domains include
- Meeting summary – total meeting participated in
- Total meetings that you organized
- Calls you made during the specified time period
- Duration spend in meeting including audio, video and screen-sharing
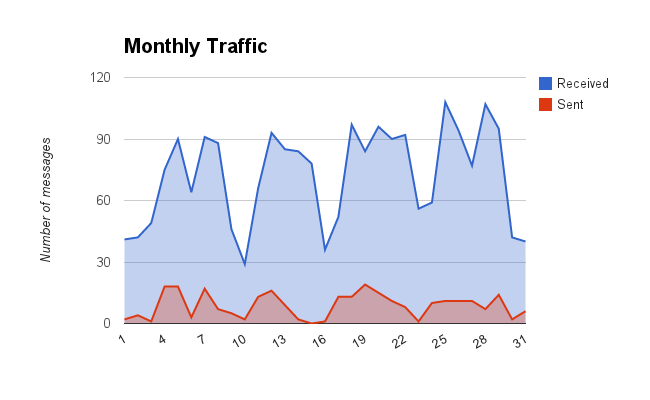
- Chat messages, channel posts and replies in the conversation
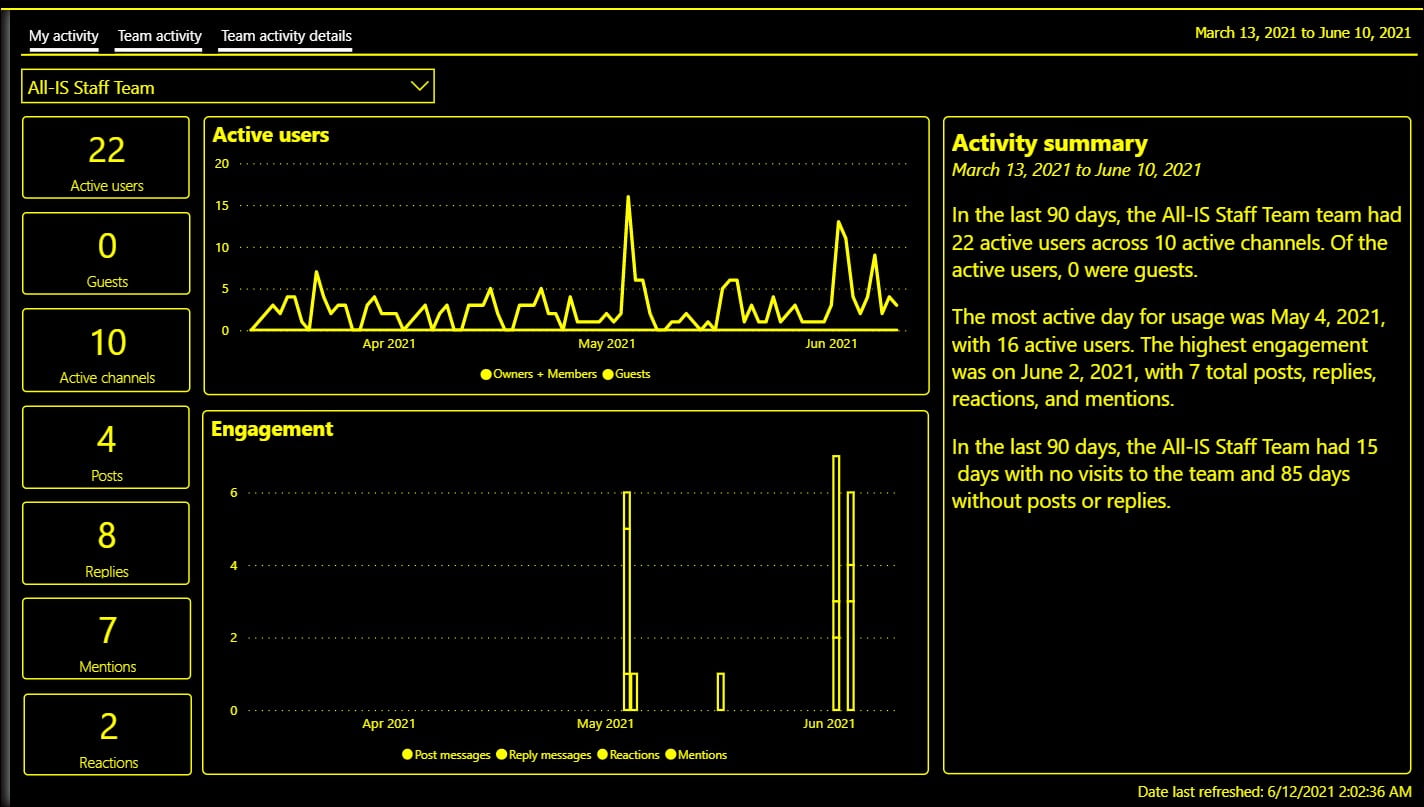
- The summary of above stats for each of your channels where are you are a Teams owner
- Total Teams and Channel posts, meeting organized per Teams, no. of active channels, total no. of guests in each Teams
- Team activity details that you’d like to know being an admin or moderator
You can always reset filters, slicers, and other data view changes you’ve made in the Power BI generated reports for Teams activities.
The Teams user activity report gives insight into the types of activities that users in your organization do in Teams. If you are a Teams admin, this article from Microsoft would be helpful to understand and share data culture in your organization; ref: Microsoft Teams user activity report.
Note: Number of daily active users (DAU) of Microsoft Teams worldwide as of April 2021 from Statista here.

Power BI is a fantastic tool for data analysis, and using it to analyze your Microsoft Teams activities is a great way to gain insights into your usage patterns. This guide provides a clear and concise overview of how to use Power BI to analyze your Microsoft Teams data. From exporting your data to creating a report, this guide covers all the important steps. It’s great to see that Power BI provides various visualization options to help present the data in an easily understandable format. I will definitely be trying this out for myself! Thanks for sharing this valuable information!