It is quite interesting to learn about your work habits, even more interesting when you have visualization of your emails, activities and log of work you perform everyday. In this article, I am tempting to perform analysis of emails, activities and log of Gmail or Google Mail (including Google Apps for Work Email) – since I use Google Apps for my personal domain, there is an extensive log available for every activities performed under the Google signed in account.
If you believe emails are history, then think again. Emails are here to stay for fairly quite long. Having said that let’s analyse email habits, and related activities. You can find scripts work for you to analyze your requirements as well.
Gmail Email Traffic Analysis
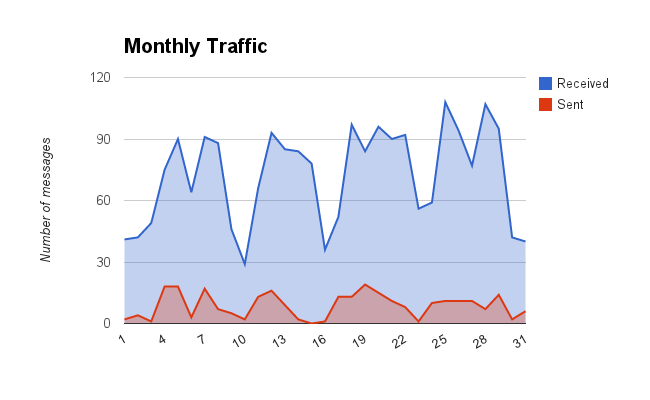
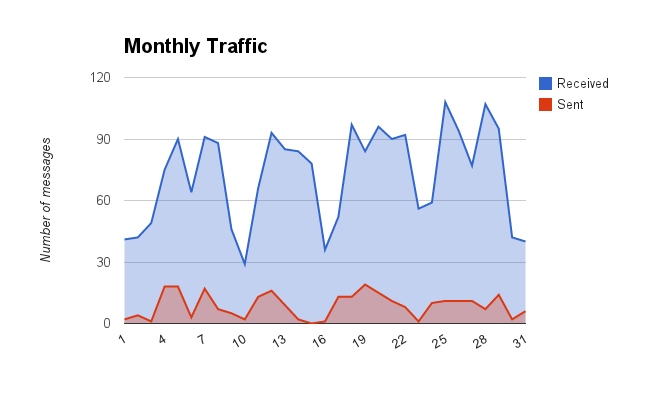
The analysis present here is based on 2246 emails received on the month of August 2014 of which 1530 conversations were created. Interestingly I have started merely 4.91% of them. I conversed with 508 people on those email volume.

My daily email traffic analysis exhibit just before the noon is the momentum to receive emails when people are just stationed at their work. The high range to receiving emails continues till evening. My responses reach peak during the later half of the end of the business day. Perhaps, I need to improve email replying habit.

Definitely days beginning of the week are high on their emails. Data show I reply most during Tuesdays (ratio of received versus sent is much higher.) Interesting I send more emails during Sundays, Mondays and Tuesdays than receive.
Email Length & Response Time Analysis
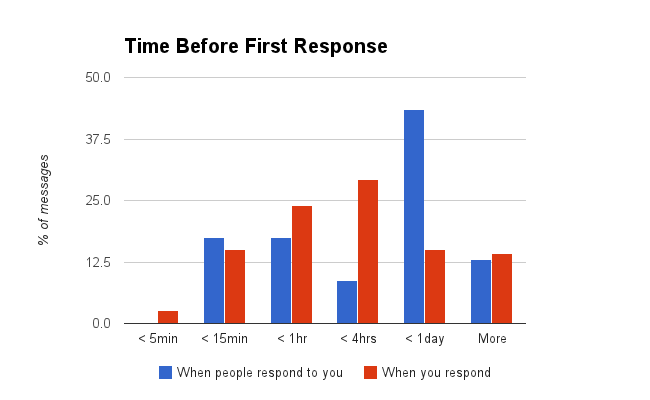
Depends on you what time frame you expect email replies to receive from the sender. The same applies the other way. I respond 24% of emails received within an hour and the other 30% within 4 hours of receiving them.
I answer most of my emails within 4hrs. How productive is that?
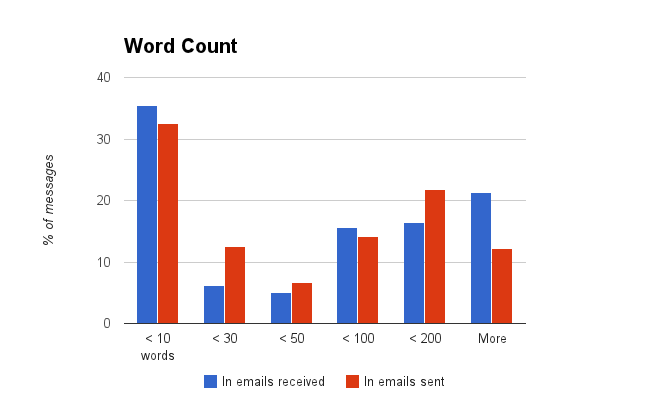
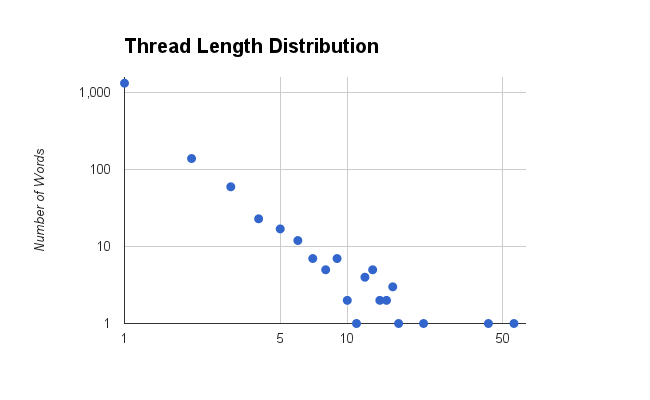
When emails I receive are either too slim or too gigantic, they both get replied on their proportionate scale. For emails of medium size or word count, I reply with pretty explanation. The thread length distribution of number of conversations with number of words is directly related to the above word count analysis.
Nature of emails engaged
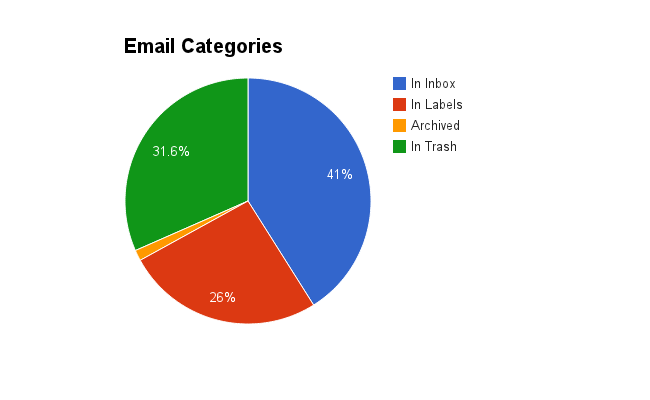
As I mentioned earlier, even though I use a personal organizational email (Google Apps for Work) this is my work email for now – hence emails sent within the domain -ekendraonline.com are way much limited. Emails with people outside my organization or domain is my actual email conversations made.

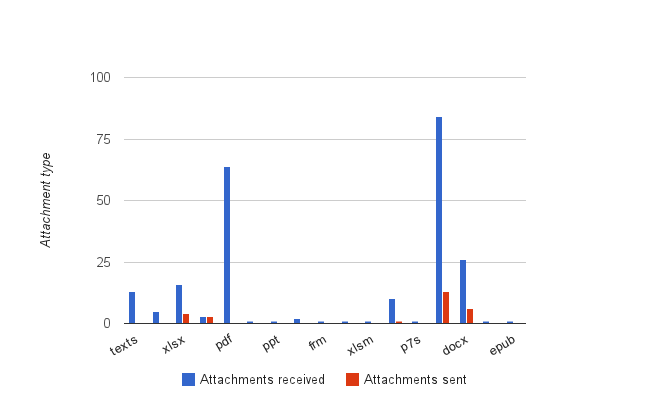
Graphs clearly depict that I receive much more email attachments than I send them – fairly enough I do not send attachments in email (unless there’s no way out) – I just cloud it. DOCX and PDF are still popular attachment file types for work.
Google App Emails Audit Report
You can now head over to the admin console to get more onto your Google Apps usage and log details. You can also check your audit report for events on your Google App domain like Service change, API Client Access modification, Application details and authorizations, and much more.

